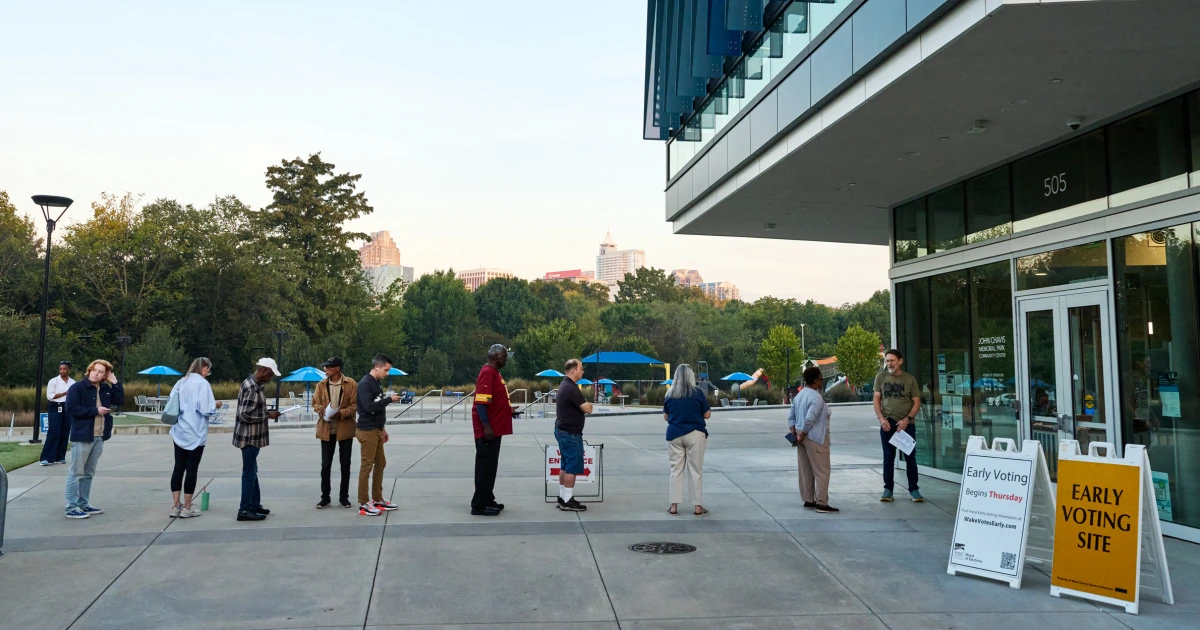
根据最新民调,民主党在国会控制权之争中领先共和党14个百分点,受众为可能投票者。或者,这一优势仅有4个百分点?答案完全取决于民调机构对一个在选举日所有选票统计完毕前无法确定的问题所做的假设:谁会真正去投票?由于民主党有望赢得众议院,且州级民调显示参议院对该党而言触手可及,投票率仍然是决定选举结果的最大未知数。
Democrats have a 14-point advantage among likely voters in the race for control of Congress, according to a new poll. Or is that edge just 4 points? The answer depends entirely on the assumptions the pollster made about a question that is impossible to answer with certainty until all votes are tallied on Election Day: Who will actually show up to vote? With Democrats favored to win the House and state-level polls showing the Senate within the party’s reach, turnout remains the biggest unknown that will decide exactly what kind of election we have.
共和党人无疑希望今年的民调低估了他们的支持,就像2016年、2020年和2024年那些唐纳德·特朗普参选的总统选举年份一样。确实,一些共和党选民,尤其是被特朗普吸引进入政坛的选民,不太可能接受民调。这引发了一个担忧:即使大多数民调机构已调整方法以试图考虑这些缺失选民,选民群体中的关键部分可能仍未出现在结果中。
Republicans are surely hoping the polls this year are underestimating their support, as surveys did in 2016, 2020 and 2024, all presidential election cycles with Donald Trump on the ballot. It’s true that some GOP voters, particularly those drawn into politics by Trump, are less likely to take polls. That raises the specter that a critical chunk of the electorate is missing from the results even as most pollsters have adjusted their methods to try to account for these missing voters.
在选票统计完毕之前,没有人能确切知道谁会投票,并且要记住,民调并非预测,只是时间上的快照。不过,全国性民调中存在一定程度的差异,这会影响我们对国会选举的看法,原因在于民调机构如何识别一个尚不存在的人群——即“可能投票者”。虽然我们并不总能确切知道调研公司如何操作,但我们利用周日发布的最新NBC新闻决策台民调结果,来说明民调机构的选择有多么重要。
No one can know for sure who will turn out until after votes are counted, and it’s important to remember that polls are not predictions, only snapshots in time. Still, there’s a level of variation playing out in national surveys with implications for how we perceive the race for Congress, and that’s because of how pollsters go about identifying a population that doesn’t yet exist — the “likely voter.”Though we can’t always know for certain how survey research firms do this, we used the results of the new NBC News Decision Desk Poll released Sunday to illustrate just how much the choices of pollsters matter.
根据我们如何识别可能投票者,民主党在今年中期选举中对国会控制权的领先优势,在共和党方面介于14个百分点到4个百分点之间。造成这种差异的原因是什么?数据中出现了两种相互抵消的力量。
Depending on how we choose to identify likely voters, Democrats have anywhere between a 14- and 4-point advantage over Republicans when it comes to control of Congress in this year’s midterms. The reason for that difference? Two different forces showing up in the data, working against each other.
虽然民主党拥有热情,但共和党人希望人口结构能成为抵御任何“蓝色浪潮”的屏障。为什么识别可能选民如此困难 预测哪个政党将在中期选举中获胜,并非像拿起电话询问人们将如何投票那么简单。预计约半数合格选民将在11月3日投票,这意味着我们在民调中接触到的相当一部分人不会投票。每家公司都有自己确定谁可能投票的方法,但所有可能选民民调都依赖两种方式来识别该群体:让选民告诉我们他们将做什么,或根据某人的身份预测其是否会投票。
While Democrats have enthusiasm on their side, Republicans have hope that demographics provide a bulwark against any blue wave. Why identifying likely voters is so hard Predicting which party will prevail in the midterms isn’t as simple as picking up the phone and asking people how they will vote. About half of eligible voters are expected to turn out on Nov. 3, which means that a significant number of the people we reach in our polls will not vote. Each firm has its own method of determining who is likely to vote, but all likely voter polls rely on two ways to identify that population: letting the voters tell us what they will do, or predicting whether someone will vote based on who they are.
有时这两者会一致,产生相似结果,但今年,它们却指向相反的方向。由于公司必须决定如何混合这两个因素,且两者都不完美,可能选民民调的结果受到不同调查公司所做选择的影响。对我们在NBC新闻国会选票民调平均值中所包含的民调进行仔细审视,可以看到这种动态的结果,即可能选民民调的波动性明显大于登记选民或成年人民调。
Sometimes these two things line up to produce similar outcomes, but this year, they push in opposite directions. Because firms have to decide how to mix these two factors, since neither works perfectly, the results of a likely voter poll are affected by the choices different survey firms make. A close look at the polls we include in the NBC News congressional ballot polling average illustrates the result of this dynamic, with the likely voter polls significantly more variable there than the registered voter or adult polls.
为了在我们的Decision Desk民调实验中产生不同的结果,我们有四种确定谁可能投票的方案。第一种方案简单地使用登记选民作为可能选民的替代。未登记的美国人无法投票,因此任何可能选民识别的通常第一步是将人群缩小到已登记的人。除了删除告诉我们自己未登记的人之外,我们还将登记选民按年龄、教育、种族、性别、人口普查地区和2024年总统选举投票的正确比例进行加权。第二种方案是听凭受访者自述,只保留那些说他们肯定会投票或声称已经投票的人。
To produce the different results for our Decision Desk poll experiment, we have four scenarios for determining who is likely to vote. This first scenario simply uses registered voters as a stand-in for likely voters. Americans who aren’t registered can’t vote, so the usual first step of any likely voter identification is to refine the population to the people who are registered. Along with removing people who told us they aren’t registered, we weighted the registered voters to the correct proportions of age, education, race, sex, census regions and 2024 presidential vote. The second scenario is one where we take people at their word, only keeping the people who say they will definitely vote or claim to have already voted.
在我们的数据中,这些人对民主党的支持度很高,这意味着一个严重依赖人们所说的他们将要做什么的模型会产生一个较大的民主党优势。这种方法的问题在于,一些不确定自己是否会投票的人实际上会去投票,而这些人大多倾向于共和党。第三种情景采取了相反的方法:我们完全忽略意图,而是依赖选民是谁来预测他们是否真的会投出选票。
In our data these people heavily favor Democrats, which means a model that relies heavily on what people say they will do produces a wide Democratic margin. The problem with this approach is that some percentage of the people who aren’t sure they will vote will actually turn out, and those people largely prefer Republicans. The third scenario takes the opposite approach: We ignore intent completely and instead rely on who voters are to predict whether they will actually cast a ballot.
为此项分析,我们查看了2022年合作选举研究(Cooperative Election Study),这是一项学术调查,关键在于它事后回溯并记录受访者是否真的投票了。利用这些数据,我们构建了一个模型,以确定当年哪些特征与投票率相关,然后用这些结果来预测谁会在2026年的数据中投票。这种方法得到的总体结果更接近平局。
For this analysis, we looked at the 2022 Cooperative Election Study, an academic survey that, critically, goes back after the fact and records whether the respondents actually voted. Using those data, we built a model of what characteristics were related to turnout that year, and then used those results to predict who will vote in the 2026 data. This method results in a top-line result much closer to a tie.
一个主要原因是人口结构。年长选民和白人选民——这些人口结构更倾向于共和党——在2022年相比年轻和非白人选民更有可能投票。但另一个主要原因是,该模型假设共和党人会以类似于民主党人在2022年的方式出现投票,以捍卫他们目前的众议院多数席位,当时共和党仅以微弱优势夺回了众议院的控制权。对于这类模型,所使用的年份对计算谁更可能或不太可能投票有很大影响。
A big reason is demographics. Older voters and white voters — demographics that lean more Republican — were significantly more likely to vote compared to younger and nonwhite voters in 2022. But another big reason is that this model assumes that Republicans will turn out to defend their current House majority in a way that is similar to how Democrats turned out in 2022, when Republicans wrestled control of the chamber away from the Democratic Party but only narrowly. For these types of models, it matters a lot which years are used to calculate who is more or less likely to vote.
如果我们而是将2022年和2018年的数据合并(2018年相比2022年更有利于民主党),我们的估计将会使民主党领先7个百分点。最后,我们可以将这两种方法结合起来。最后的估计再次基于2022年的数据构建模型,但它同时考虑了每位受访者的特征及其投票意向。
If we instead pooled 2022 and 2018 (a much more Democratic-friendly year than 2022), our estimate would favor Democrats by 7 points. Finally, we can combine the two methods together. The last estimate again builds a model on 2022 data, but it takes into account each respondent’s characteristics and their intent to vote.
我们进一步调整处理意图的方式:不再用一条硬性界限将一些人划分为确定的选民,另一些人划分为确定的非选民,而是根据人们在给出特定答案后投票的可能性来分配概率。例如,2022 年,大约 15% 的人说他们不会投票,但实际上还是投票了,因此在这个模型中,说他们不会投票的人至少也会获得一点权重。毫不奇怪,将这两种信号混合在一起会产生一个结果,该结果位于另外两种结果之间。
And we further adjust how we deal with intent: Instead of a hard line separating some people as definite voters and others as definite nonvoters, we assign a probability based on how likely it is people vote after giving a particular answer. For example, in 2022, around 15% of people who said they wouldn’t vote actually did, so in this model the people who say they won’t vote get at least a little weight. Unsurprisingly, mixing both these signals produces a result that sits somewhere in between the other two.
平衡所有这些因素的需求意味着,调查公司基于合理的选择,有很大的空间从相同的底层数据中产生不同的结果。2026 年的变化在行动中体现 一种真正看到今年变化的方法是查看同时发布同一项民意调查中登记选民和可能投票者结果的民调机构。考虑两家在九月中旬都发布了调查的知名民调机构。这两家机构都发布了关于登记选民和可能投票者在 2026 年投票选择的结果。
The need to balance all of these factors means that survey firms have enormous leeway to produce different outcomes from the same underlying data based on reasonable choices. The 2026 variation in action One way to really see the variations this year is by looking at pollsters who release results for both registered voters and likely voters from the same poll. Consider two prominent polling firms that both released surveys in mid-September. Both polls released results on 2026 vote choice for both registered voters and likely voters.
在这两家机构对登记选民的意见上基本一致:《经济学人》/尤戈夫(The Economist/YouGov)报告称,登记选民中民主党领先 5 个百分点,而《纽约时报》/锡耶纳(New York Times/Siena)报告称民主党领先 7 个百分点。他们之间的分歧在于他们认为,当聚焦于那些可能投票的人时,这些数字会如何变化。《纽约时报》/锡耶纳民调认为,那些将出去投票的人仅比所有登记选民稍微更倾向于民主党,从而使得可能投票者群体中民主党领先 9 个百分点。
The two firms were close to agreement on the opinions of registered voters: The Economist/YouGov reported a Democratic 5-point advantage among registered voters, while New York Times/Siena reported 7-point edge. Where they differ is how they think those numbers shift when focusing on those likely to vote. The New York Times/Siena poll thinks that those who will turn out to vote are only slightly more pro-Democratic than all registered voters, producing a likely voter group with a 9-point advantage for Democrats.
这表明,这家民调机构认为,今年支持民主党和支持共和党的人之间的投票率将大致相当,因此在可能投票者中的结果总体上代表了所有登记选民。
This suggests that this pollster thinks that turnout between those who favor Democrats and those that favor Republicans will be pretty even this year, producing a result among likely voters that is broadly representative of all registered voters.
相比之下,《经济学人》/YouGov 的民意调查显示,可能的选民将比所有已登记选民更倾向于支持民主党,该群体对民主党的支持优势达到正十二个百分点。该民调认为,支持民主党的已登记选民比支持共和党的已登记选民更有可能出席投票。根据我们对两家机构如何确定可能选民的了解,《纽约时报》/锡耶纳民调描述了一种可能选民的判定方法,该方法结合了受访者在2022年和2018年的投票行为以及每位选民自述的投票意向。
In contrast, the poll conducted by The Economist/YouGov suggests that likely voters will be significantly more pro-Democratic than all registered voters, with that group having a plus-12 edge for Democrats. This poll thinks that the registered voters who support the Democrats are more likely to turn out to vote compared with those who support Republicans. From what we know about how each determined their likely electorate, the New York Times/Siena poll describes a likely voter method that combines what respondents did in 2022 and 2018 with each voter’s self-described intent.
《经济学人》/YouGov 民调则表示,他们在判断时也考虑了选民的投票意向。两种方法都合理,实际结果很可能介于两者之间。没有任何民调机构能够确切知道最终结果会落在何处。
The Economist/YouGov poll reports taking into account intent. Both are reasonable methods, and the real result likely lands somewhere in the middle. No pollster knows exactly where that will be.